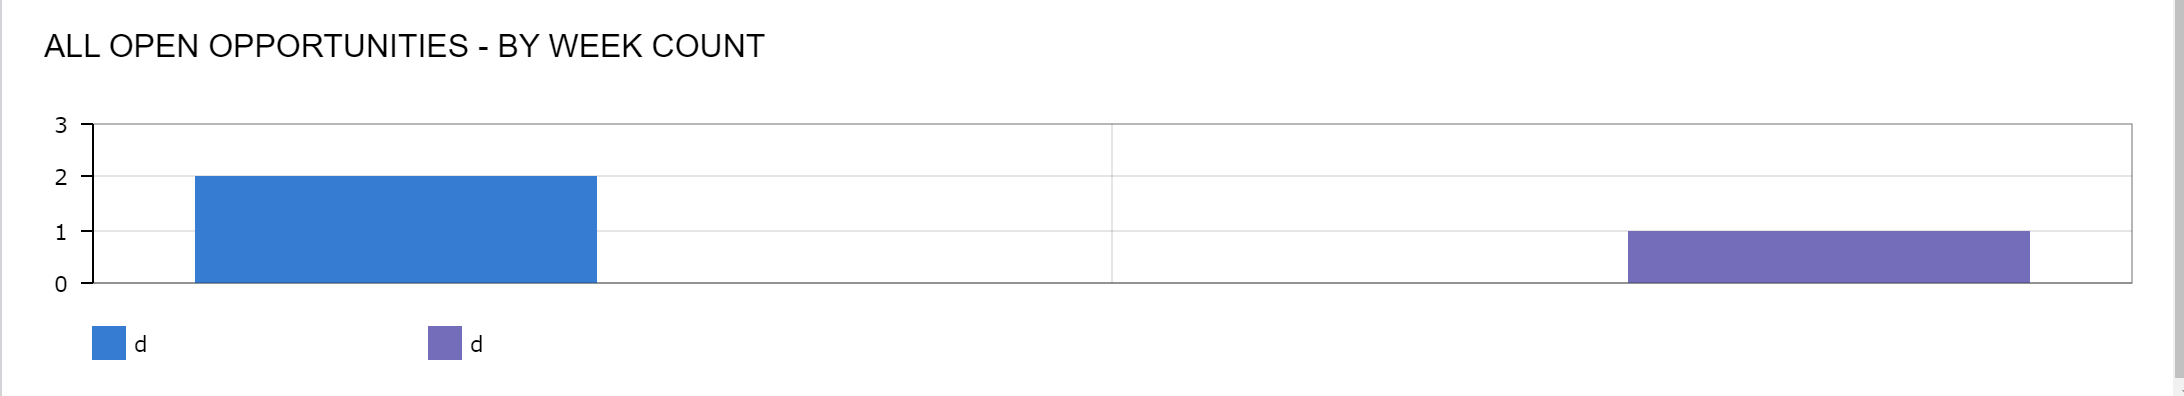
Is there a way to filter Opportunities by week count and show as bar charts in dashboard widgets? The y-axis would be the count of how many opportunities there are, and x-axis would be the first date of each week. I’m not sure what to specify in the chart setting (shown below) and how to name the legend to date (mm/dd/yyyy).