GI for All Project Budget Forecasts

  • 1 February 2024
  • 4 replies
  • 73 views

We are a Professional Services firm that is relatively new to Acumatica (August 2023 go-live). Prior to having an ERP, we were using a mesh of systems that didn’t communicate with one another, mainly Sage50 and excel. One of these items, however, became a staple in our Revenue/Cash Flow forecasting. It was essentially a custom built behemoth that was added to every time a new engagement was signed and/or scheduled. From there it would aggregate by month and we could pretty accurately predict what we could expect our top line to look like. We also used it to track billing and hold the engagement leads accountable when they were not billed in a timely manner. This information was also used to project cash flow for the month, which is vital as we tend to see some seasonality. 
 

Fast forward to now- we have graduated into using Projects for each of our engagements, which was the ultimate goal with Acumatica. This has been great! However, we haven’t quite accomplished moving the aforementioned excel form into Acumatica itself for real-time information. We have utilized our implementation partners to help us create a GI that returns the Project Budget Forecast amount for each project, each month, but this still misses the mark. Namely, we are unable to track how much of this Project Budget Forecast has been billed each month, and this GI only returns one task/item from the revision. It also requires us to create a revision for each project and there are over 350 projects throughout the year. It’s a bit more tedious than entering it into excel, though not difficult in any respect. 
 

Does anyone have the same experience or any suggestions to solve this? My guess would be a GI, but I could be wrong. 

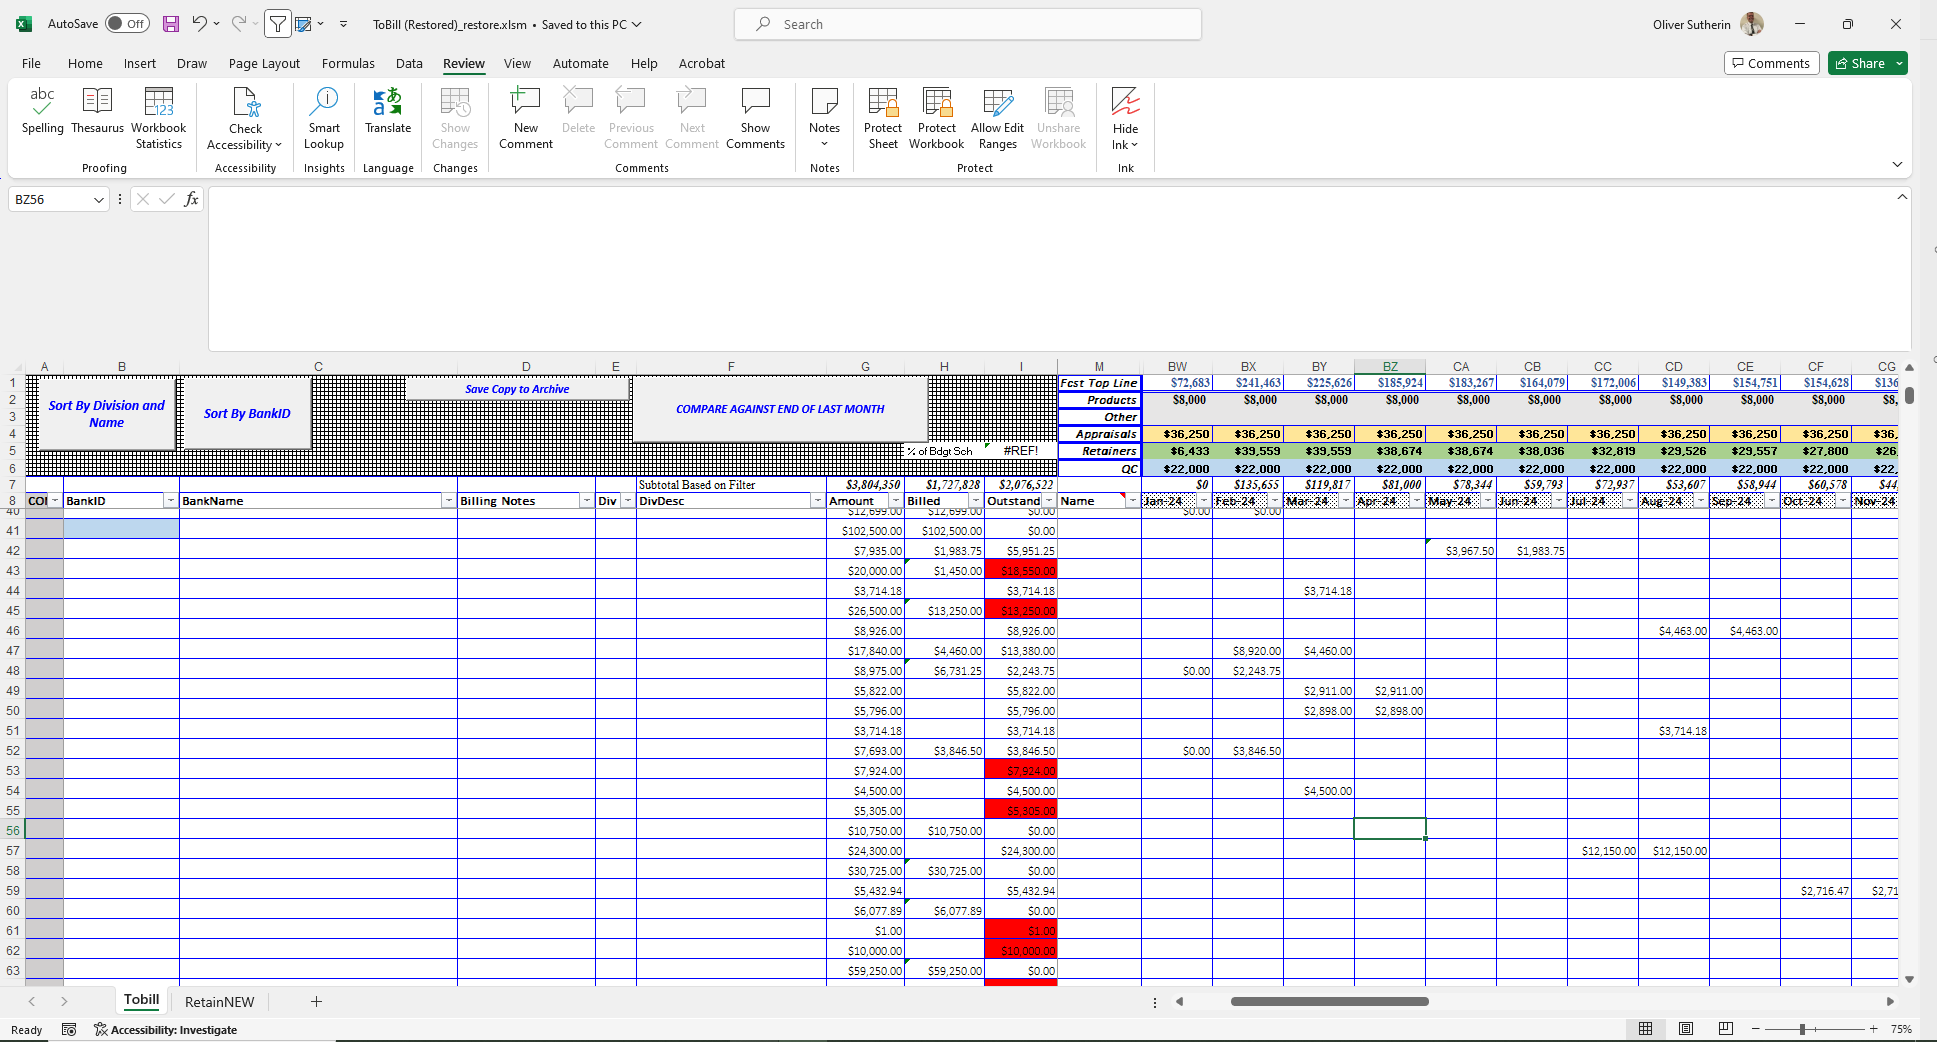
What the spreadsheet effectively shows is a row for each project that we perform, the professional fees for that project, as well as the forecasted date for the revenue. 

I personally think a GI is not the answer in this scenario, but I wanted to see what, if anything, my alternatives were. 

Our implementation partners have pitched Velixo to us, but I am hesitant to purchase and roll out another platform 8 months after implementing Acumatica. 

PowerBI is also something that I looked at, but it requires GIs and I haven’t even addressed the root of the issue and that is configuring a GI to generate the data that matches the excel worksheet in the picture. 


I think a GI would give you a start but there are limits to the capabilities of a GI.  I have used database views in a customization to retrieve summary data by an entity so that the GI doesn’t have to do the math.  If I assume that each line of your spreadsheet is a customer and maybe we are looking all sales orders.  Possibly the data in rows 1 through 6 could be calculated in a view and linked into the GI.  Otherwise, a pivot table might give you the monthly revenue break out.

You might also consider Power BI where you could pull raw data from different GIs and combine them into the final presentation.  There also is a product called Velixo that might also serve to pull the data your spreadsheet.


This is a snippet of what the workbook looks like. It is not overly complicated for what we use it for. Where it does get complicated is the calculations and formulas throughout. This, however, would not be relevant in Acumatica. 


I will also note that the buttons at the top for Compare Against Last Month, etc. are rarely used. We wouldn’t need to carry that into Acumatica.


Can you provide a copy of the spreadsheet with all of the customer private information blacked out?


Reply