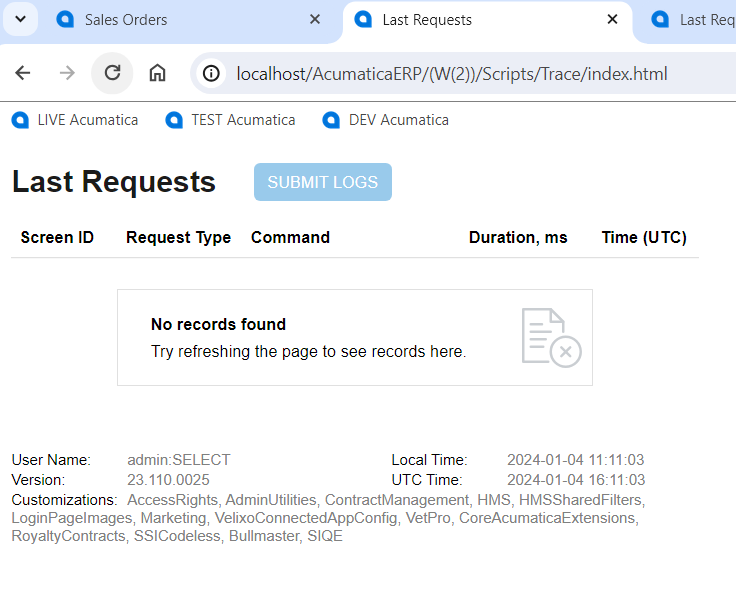
My local development with Acumatica ERP 23R1 (any version) does not display Trace details
in the improved Trace window when opened on a page via the Tools » Trace option.
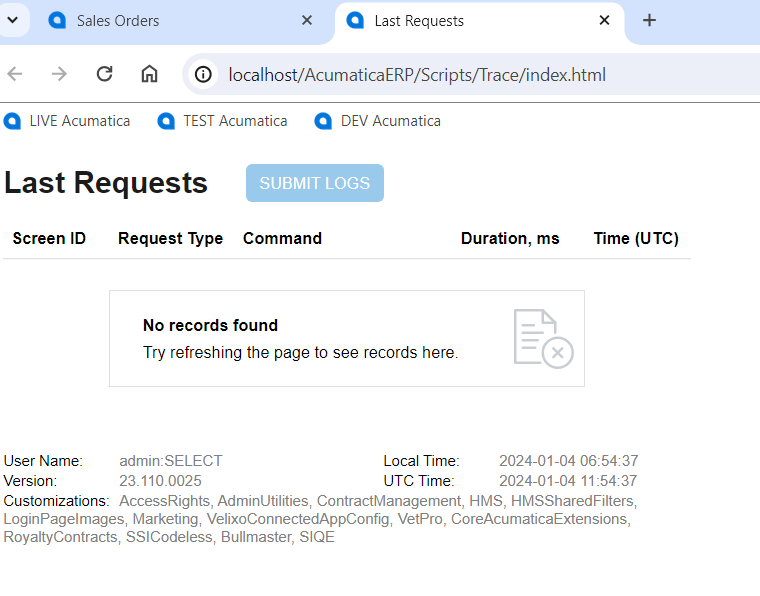
It shows No records found.
Has anyone else encountered this issue?
The Improved Trace works fine on our development server, but not under localhost/iis.
Best answer by jedmunds36
View original