I have a pivot chart and want to add a calculated column.
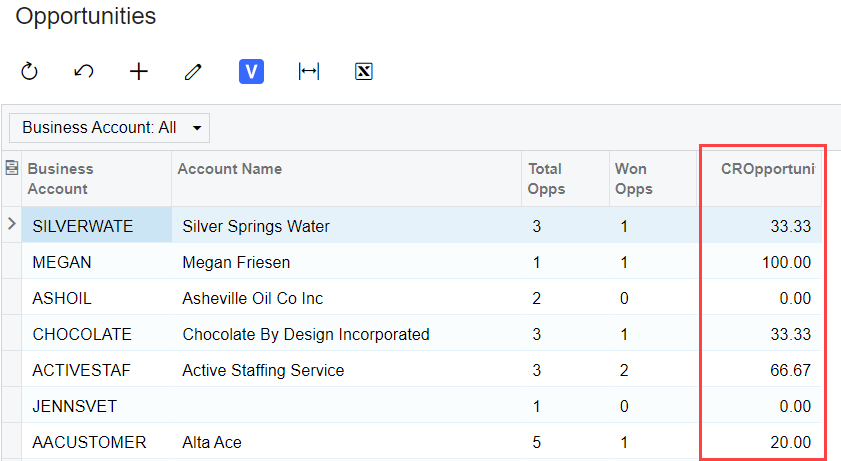
The pivot chart is from the opportunities GI - I have rows by customer, a columns for quantity of won quotes and total quantity of quotes. I want to add a calculated column for % of won.
Thank you!
Page 1 / 1
Hello,
I don’t think it’s possible today in a pivot table. There’s an idea here on the portal that looks like it’s the same as what you’re asking for:
But for your scenario, I think you should be able to do it in a generic inquiry. You’d need to group by customer/business account and you may want to filter for a specific date range, but if you use a formula something like =sum(iif( CROpportunity.Status]='W',1,0))/count('CROpportunity.OpportunityID]) * 100
then you should be able to get the Win percentage
For some reason the win percentage doesnt calculate using that formula. The sum of wins calculates correctly, the count of opportunities calculates correctly, but when using the entire formula, the lines with anything other than a quantity of 1 do not show a percentage. Thoughts!?
Maybe it’s something to do with the format of the data in the “Count” portion? Changing the data format to “Decimal” for the Count portion seems to work with my sample data,