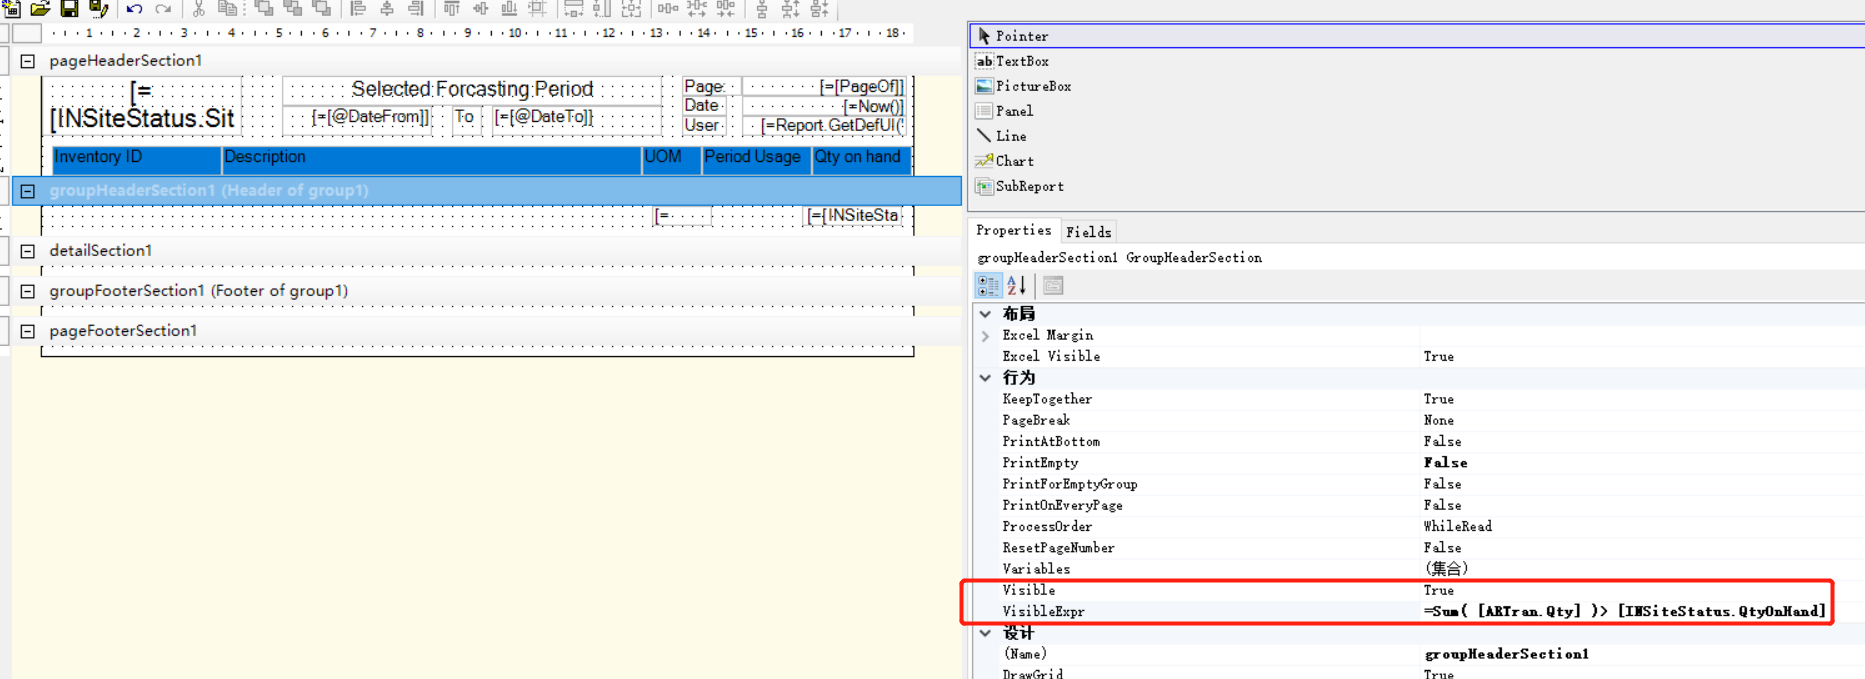
Hello, I wrote a GI for our company to hightlight the lines using the below formula:
=IIF([ARTran.Qty]>[INSiteStatus.QtyOnHand],'orange40','default')
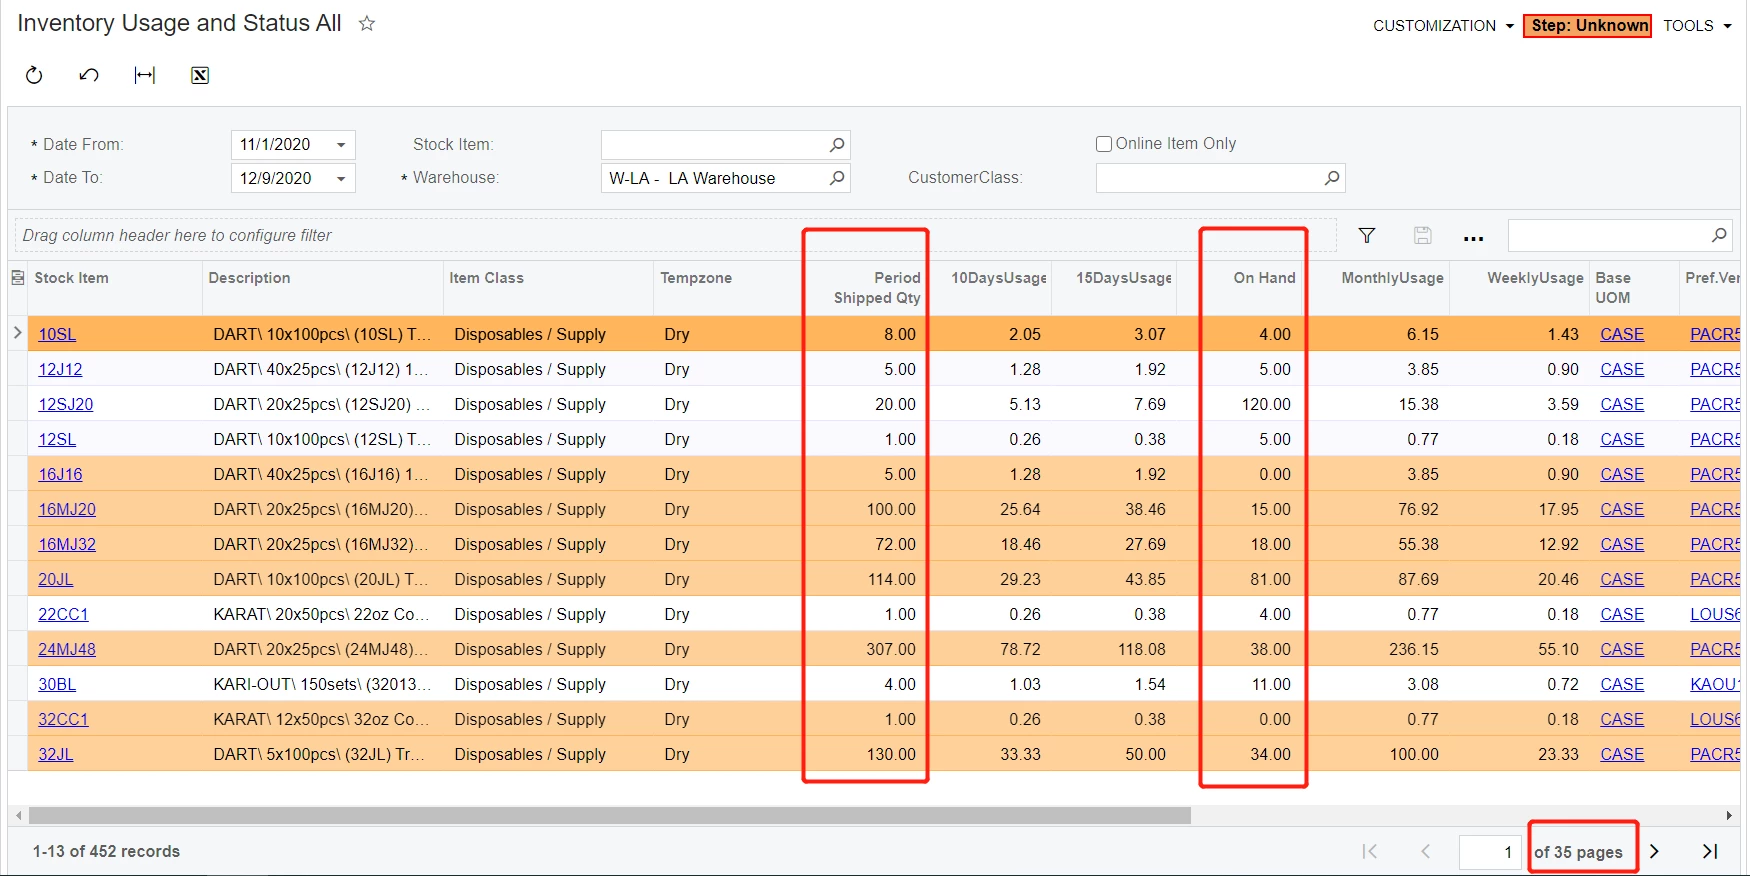
It works OK. However, you see, we are having 36 pages,
And if the management team would like to view the on hand qty below period usage qty lines,
he have to click 35 times to view all pages.
Is there a way to filter out the lines by the highlight colors?
I am thinking out add a new column with value :
[ARTran.Qty]-[INSiteStatus.QtyOnHand]
However [ARTran.Qty] should by SUM
while [INSiteStatus.QtyOnHand] is by AVG
This column won’t get the expected result.
Any suggestions?
Best answer by porlov
View original