An excel summary report for chain stores with multiple branches

  • 21 January 2021
  • 3 replies
  • 136 views

Userlevel 6
Badge +5

Hello,

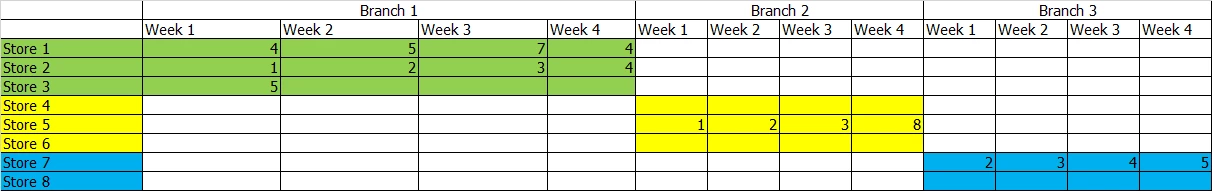
      We serve chain stores, and they are requiring a report every month like below:

The cell value is the weekly usage of that single store

      store 1,2,3 is served by branch 1, store 4,5,6 is served by branch 2, store 7,8 is served by branch 3


       Yes, this report can be done, if we run an inquiry by branch. 

And manually merge the data together to each colored section in excel.


       But my colleague is tired of doing the merge again and again.

       Is there a way to help him fill in the excel more quickly?


        I am thinking of “Pivot Table”

or        the “Excel Sync function”  from different GI data sources, the problem is excel sync can not be parameterized.

       or “the report designer”,  the problem is the layout


       Which way do you think is the best way to fulfill my need? Or Can my need be fulfilled?

       Please advise. Thank you.


3 replies

Userlevel 7
Badge +10

Hi @ray20,

You should look into the solution that I built, Velixo. Although we primarily focus on financial and project reporting, we do have the ability to query from any table/screen in Acumatica through Generic inquiries. You can setup arbitrary tables in your spreadsheet and use the =GI() and =GILOOKUP() functions to get the data you need. The functions can be parameterized (I would assume in your case the parameters are branch name, store number and week number?), and we do data caching and incremental loading for top performance.

It is a single-click refresh, which your colleague will like 😊

I’ll be happy to walk you through the solution and give you a trial, drop me a message.

Userlevel 6
Badge +1

This sure looks like a Pivot Table to me. You can use native Excel, as long as you’re running Excel on Windows (and hopefully the latest Office 365 version of Excel), to connect Excel to an Acumatica Generic Inquiry via OData and bring the data into the Excel Power BI Data Model, then build a Pivot Table on top of it.

I think I could show you how to do it in 1-2 hours using my consulting offering: https://www.augforums.com/consulting

Userlevel 6
Badge +5

@Gabriel Michaud @TimRodman 
Thank you, Gabriel and Tim, thank you for your always help. 
Currently, this feature is a nice to have request by my colleague. so It is not a must have feature, and we don’t have any budget for it at this moment. I will seek for your professional help if our business grows and we do need more complicated and nice-looked report. Best wishes.

Reply


About Acumatica ERP system
Acumatica Cloud ERP provides the best business management solution for transforming your company to thrive in the new digital economy. Built on a future-proof platform with open architecture for rapid integrations, scalability, and ease of use, Acumatica delivers unparalleled value to small and midmarket organizations. Connected Business. Delivered.
© 2008 — 2024  Acumatica, Inc. All rights reserved