From past many days, we have been facing this issue in Acumatica.
While working on ongoing cases or business accounts, we get an alert of The Session has expired issue and sometime You are currently logged off.
Our Chrome is updated to the latest version and though we clear all cache and cookies, still after some days it gives the same error/alert.
The session timeout in web.config is set to 600 mins.
Highly appreciate your support.
Page 1 / 1
VICTORY!! While @Naveen Boga is correct in that coding can create a leak (potentially solved by writing in timeout limits) this was not caused by that. Instead, I discovered that it was caused by a few automation schedules running amok.
Specifically, I had created a recalculate inventory automation schedule that was running all the time even though it was scheduled to run only at night. Apparently it was caught in a loop. I later found out that in order to minimize the risk of this “loop” happening again I should check Exact Time in the schedule.
Here is where I discovered the issue. Once I noticed the time of day it was running and the frequency I was sure this was the problem. When the schedule was deactivated the issue resolved.
System Monitor>System Events
Hi @sanjayverma In my past I have seen similar kind of issue.
In my case, I got the Session Expired issue due to memory leakage (graph is hiking up continuously and got session expired issue). We went back reviewed our code of each customization and found few gaps and fixed it.
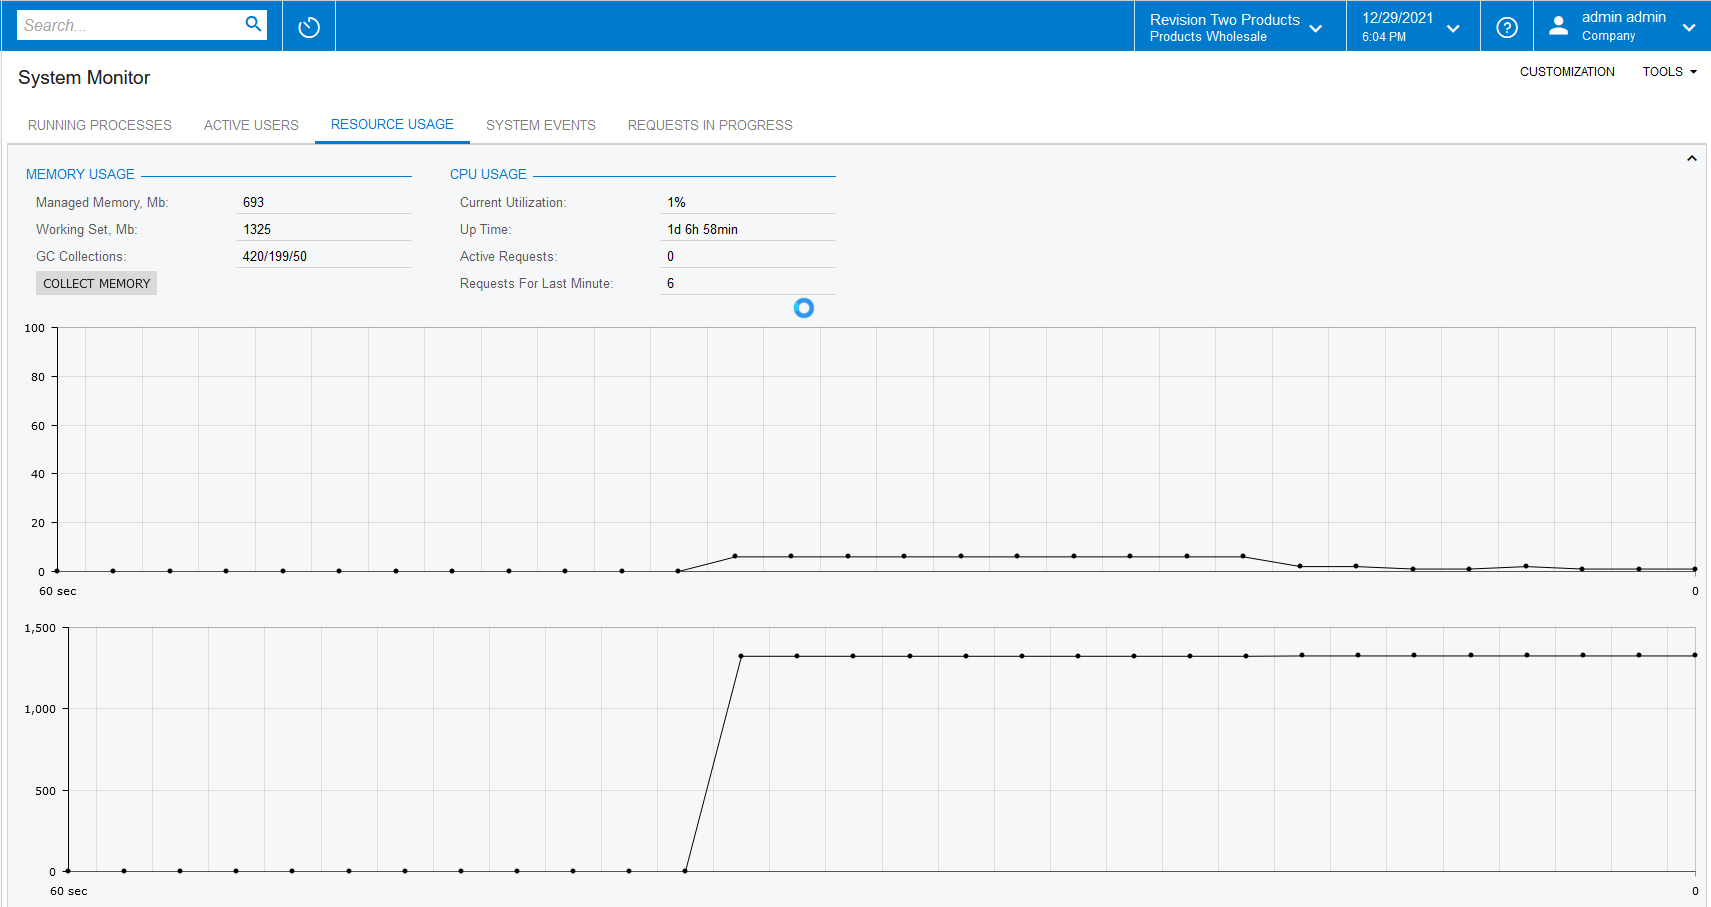
Have you observed “Memory Utilization” and “CPU Utilization” in the System Monitor screen?
Also, Have you published customizations (during off business hours) and verified, and still getting the same issue ?
Hi @sanjayverma But, you have confirmed that without customizations also, you are getting this issue right?
To check the memory leakage, please submit your code to technical expert from your team to review the code to identify if any bad code is written OR you can submit your Acumatica support team.
According to me, there is definitely a bad written and that is causing this issue.
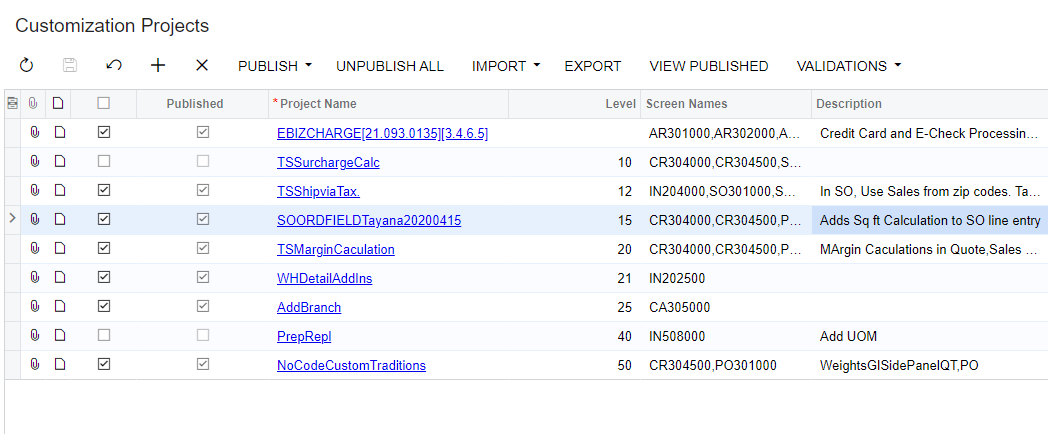
I started a case as one of my clients is being affected as well. Here are the customization packages we have. If anyone recognizes similarities please advise. I will update this thread when I hear back from Acumatica...if you could do similar maybe we can get to the bottom of it!
-David Gross
VICTORY!! While @Naveen Boga is correct in that coding can create a leak (potentially solved by writing in timeout limits) this was not caused by that. Instead, I discovered that it was caused by a few automation schedules running amok.
Specifically, I had created a recalculate inventory automation schedule that was running all the time even though it was scheduled to run only at night. Apparently it was caught in a loop. I later found out that in order to minimize the risk of this “loop” happening again I should check Exact Time in the schedule.
Here is where I discovered the issue. Once I noticed the time of day it was running and the frequency I was sure this was the problem. When the schedule was deactivated the issue resolved.
System Monitor>System Events
That’s great news!!!!
I also checked the code for any memory leakages but could not find anything suspicious.
I will check for automation schedule.
It’s still an issue.
We have the same issue. Did you find a resolution?
Nope.. we are still facing the issue. No resolution yet.
Hi @sanjayverma If you have not raised a support ticket, I would recommend you to raise a support ticket. They will review the additional logs from their end and let you know the exact root cause of this issue.
I started a case as one of my clients is being affected as well. Here are the customization packages we have. If anyone recognizes similarities please advise. I will update this thread when I hear back from Acumatica...if you could do similar maybe we can get to the bottom of it!
-David Gross
Hey David,
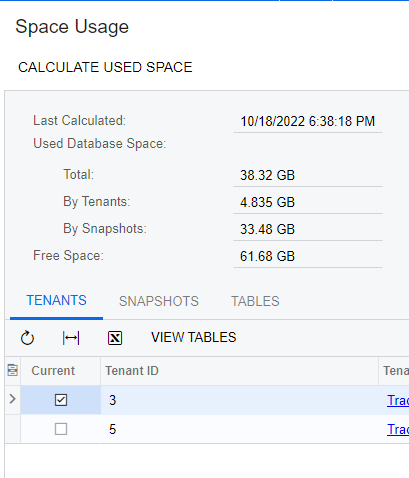
It seems that Acumatica has some memory leakages internally. May I know your size of database? Also, can you please share if only specific users are facing this?
It’s not that. It was updated to 4 hrs.
Even, I have updated it for 9 hours. but still the issue remains as it is.
Hi @dgross54 - thank you for sharing with the community!
It’s still an issue.
We have the same issue. Did you find a resolution?
It’s still an issue.
Thank you Naveen for your prompt response.
We did check the CPU utilization & Memory Utilization which seems to be fine. Regarding customizations, we tried publishing during production off hours as well. But it didn’t resolved the issue.
Please note that only 3 to 4 users are facing this issue and others are not facing it.
Please advise further steps.
Hi @sanjayverma
Can you ask those users to clear browser cache/history and monitor (since issue is experienced by specific users). What browser are they using?
Regards,
Hi Vijaykumar,
We already cleared browser cache/history. The users are using Chrome browser with latest version. However, it is not resolving the issue.
The users are getting the same issue again and again.
Please advise.
Hi @sanjayverma If you have not raised a support ticket, I would recommend you to raise a support ticket. They will review the additional logs from their end and let you know the exact root cause of this issue.
You are correct. We are raising a ticket now.
However, I believe that it is related memory leakage. but I don’t know how to find it out.
Could you please advise.
@sanjayverma
Sanjay, it is not user specific. They provided an example of 5 users already today and it happened to me as well. If the below is not helpful then you can refer to case 274994 for more details.
Hey David,
I don’t have access to your case#. However, you can check for session timeout period in your web.config file.